 By Naman Gundaniya
Observability for LLM Apps: Tracing What Your Agent Did
LLM observability means recording every step an LLM app or agent takes, as a trace of nested spans for model calls, retrieval and tool calls, with inputs, outputs, tokens, cost, latency and model version attached. The signals that predict problems are quality and behaviour metrics, such as acceptance rate and steps per task, not just errors and uptime.
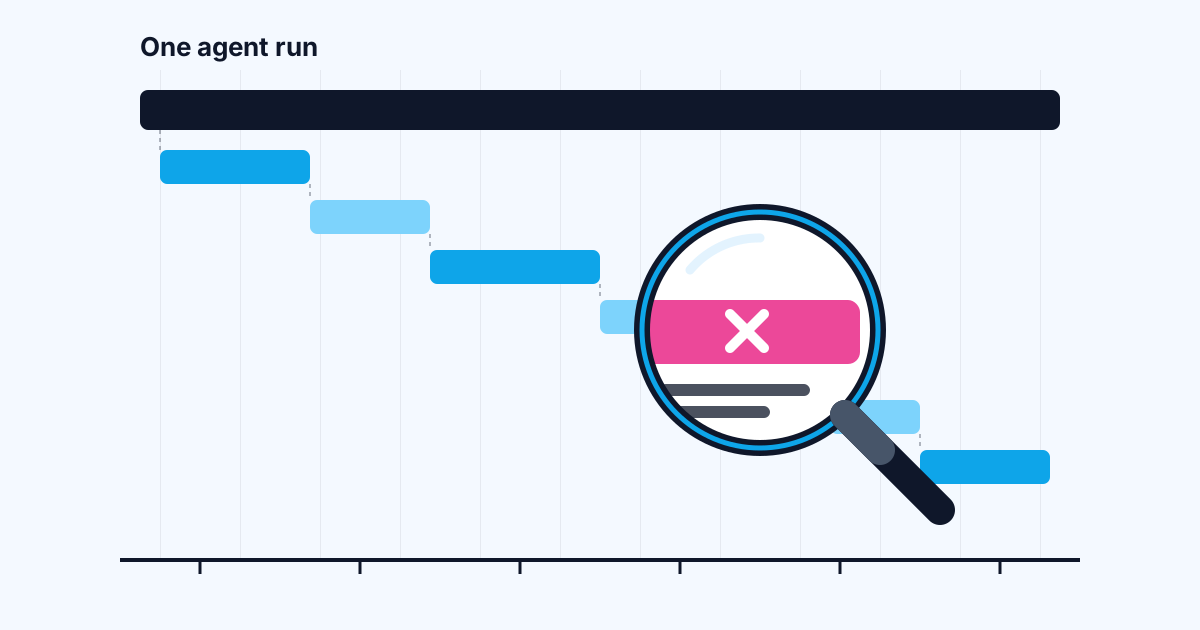
When a normal web request goes wrong, a stack trace usually tells you where. When an agent goes wrong, it typically does not crash. It takes eleven steps instead of four, calls the wrong tool with plausible arguments, and returns a confident answer built on the wrong document. Without a record of each step, all you have is a user saying "it gave me nonsense" and no way to reproduce it.
Observability for LLM apps fixes that. This post covers what to capture, how to structure it, which metrics actually warn you before users do, and how to choose tools. It complements my post on AI agent evaluation: evals tell you whether a change is better, and observability tells you what happened in production.
What is LLM observability?
LLM observability is the ability to see, after the fact, exactly what your application sent to the model, what came back, what tools it called and what all of it cost, for any individual request. It borrows the vocabulary of distributed tracing: a trace is one end-to-end request, and spans are the steps inside it, nested to show which step called which.
Langfuse's observability docs describe application tracing as "structured logs of every request that capture the exact prompt sent, the model's response, token usage, latency", and note that each trace captures every operation, including LLM calls, retrieval steps, tool executions and custom logic. That is the core of it. Everything else is dashboards and alerts built on top.
The reason it matters more for LLM apps than for ordinary services is that the interesting failures are semantic. Hamel Husain's post on AI product evals puts the dependency plainly: "A prerequisite to performing human and model-based eval is to log your traces." You cannot review what you did not record.
What should a trace capture for an AI agent?
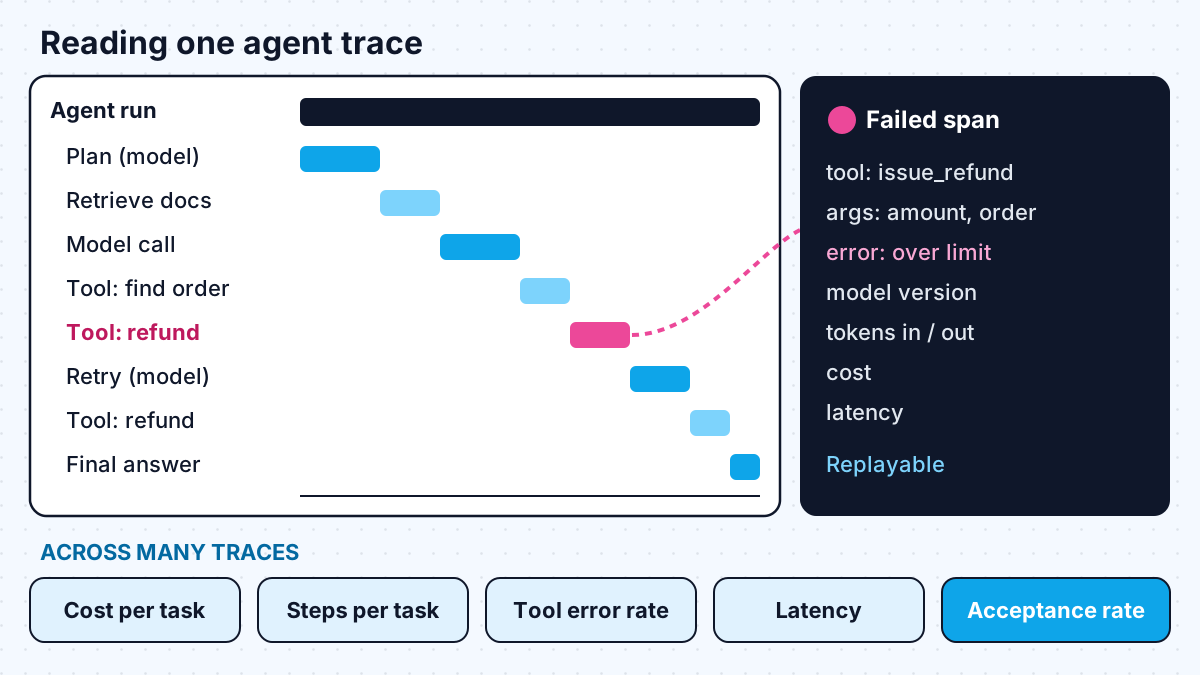
A useful agent trace records each step as a span with enough detail to replay it. For an agent run, the spans usually look like this:
- Agent run (the root span): user, session, task, final outcome, total cost and duration.
- Model calls: model name and version, provider, input and output messages, token counts including cache reads, finish reason, latency and time to first token.
- Retrieval: the query, which documents came back, their scores, and which ones made it into the prompt.
- Tool calls: tool name, arguments, result, duration and whether it succeeded.
- Guardrails and validation: schema checks, policy checks and approvals, with pass or fail.
OpenTelemetry has a set of semantic conventions for generative AI that standardises these names. The client inference document, still marked as Development status as of late 2026, recommends span names in the form {gen_ai.operation.name} {gen_ai.request.model} and defines attributes such as gen_ai.provider.name, gen_ai.request.model, gen_ai.input.messages and gen_ai.output.messages, along with token usage metrics that separate cache-read and cache-write input tokens. Sibling documents in the same repository define spans for tool execution and agent invocation. Using these names, even before they are final, makes it much easier to switch backends later.
Which signals actually predict problems?
The signals that predict problems are the ones that move before users complain: quality, behaviour and cost per unit of work. Error rate and uptime matter, but an agent can be up, error-free and wrong.
| Signal | What it predicts | How to measure it |
|---|---|---|
| Acceptance or edit rate | Users losing trust | Share of outputs used as is; size of user edits |
| Steps per task | Agent confusion or loops | Count of model and tool spans per root trace |
| Tool error rate | Broken integrations, bad arguments | Failed tool spans divided by total tool spans |
| Cost per successful task | Cost creep | Sum of span costs for traces that ended in success |
| Retrieval hit rate | Stale or missing knowledge | Share of traces where a cited document was retrieved |
| Validation failures | Model or prompt regressions | Schema or policy check failures per thousand calls |
| Time to first token | Perceived slowness | Measured on streaming model spans |
| Model version mix | Silent model changes | Count of calls per model version |
A few notes from practice:
- Steps per task is the earliest warning I know for agent trouble. A jump from four steps to nine usually means a tool description changed, a retrieval source went stale, or the model is going round in circles.
- Cost per successful task beats total cost. Total cost should grow with usage; cost per success should not. If you are already budgeting per user, the same traces feed the limits in capping LLM costs per user.
- Model version mix catches the case where a fallback or alias quietly routes traffic to a different model.
I group these failure signals in more depth in why AI features fail after launch.
How do you add tracing without leaking data?
Tracing an LLM app means storing prompts and responses, which often contain personal or confidential data, so privacy has to be part of the design. The same traces that help you debug can become your biggest data exposure.
The approach I use on client projects:
- Redact before export. Strip or mask emails, phone numbers, account numbers and other identifiers in the instrumentation layer, before spans leave your infrastructure.
- Separate metadata from content. Keep tokens, cost, latency, model version and outcome for every call; capture full message content selectively, for sampled traces or flagged failures.
- Set retention deliberately. Short retention for content, longer for aggregated metrics.
- Control access. Traces should be readable by the people who need to debug, not by everyone with a dashboard login.
- Treat the vendor as a processor. If a hosted tool receives prompt content, it belongs in your data processing agreements.
Traces are also a security tool. A log of every tool call with its arguments is how you notice an agent being steered by injected instructions, which I cover in prompt injection explained.
How do you add observability to an app that already exists?
Start with the model calls, because they are where cost and quality live, and work outwards. Retrofitting tracing onto a live LLM feature is incremental work, not a rewrite, if you go in this order:
- Wrap every model call in one place. If calls are scattered across the codebase, route them through a single client function first. That function becomes the natural home for the span.
- Record the basics on every call: model and version, token counts, latency, cost and finish reason, plus a request ID that ties the call to the user action that caused it.
- Add a root span per user action, so the model calls, retrieval and tool calls for one request group into one trace rather than floating as separate log lines.
- Instrument tools and retrieval next. Tool name, arguments, result status and duration; retrieval query and the IDs of documents returned.
- Build one dashboard and one weekly habit. Cost per task, steps per task and tool error rate on a single page, and a standing slot to read a sample of traces by hand.
The weekly reading habit is the step teams skip, and it is the one that finds the problems no metric was designed to catch.
How do you choose an LLM observability tool?
Choose on three questions: does it trace the frameworks you actually use, can it run where your data is allowed to live, and does it connect traces to evaluation. Most tools in this space do roughly the same core job, so the differences are in hosting, ecosystem and workflow.
| Tool | What its docs emphasise | Worth noting |
|---|---|---|
| Langfuse | Traces of prompts, responses, tokens and latency, with nested observations | Open source and can be self-hosted, per its docs |
| LangSmith | Visibility from individual traces to production-wide metrics | Lists integrations beyond LangChain, including OpenAI, Anthropic and Vercel AI SDK |
| Arize Phoenix | Tracing, evaluation, prompt iteration and experiments | Built on OpenTelemetry and OpenInference, per its docs |
| Your existing APM via OpenTelemetry | GenAI semantic conventions on standard traces | Keeps AI traces next to the rest of your system |
LangSmith's documentation says it "works with many frameworks and providers", and Phoenix's docs describe it as "built on top of OpenTelemetry and is powered by OpenInference instrumentation". For EU clients or regulated data, the self-hosting question often decides it before features do.
My practical advice: start by instrumenting with OpenTelemetry-compatible libraries and the GenAI conventions, send traces to whichever tool fits the hosting constraint, and avoid hand-rolled logging formats you will have to migrate later. The tool matters less than the habit of reading traces every week.
Work with me
I build AI agents and integrations with tracing, cost tracking and quality metrics in place from the first release, so problems show up on a dashboard before they show up in support tickets. See AI agent development and AI integration, browse my work, and book a scoping call.
Frequently asked
What is the difference between LLM observability and LLM evaluation?
Observability records what your app did on real requests in production: every model call, tool call, token and cost. Evaluation measures quality against a defined standard, usually on a test set before a change ships. They feed each other, because production traces are the best source of new evaluation cases.
What is a trace in an LLM application?
A trace is the full record of one request, from the user's input to the final output, made of nested spans for each model call, retrieval step and tool call. Each span stores its inputs, outputs, timing and cost, so you can see exactly where a bad answer came from.
Is OpenTelemetry ready for LLM tracing?
OpenTelemetry publishes semantic conventions for generative AI covering model calls, token usage, tool execution and agent invocation, though they were still marked as Development status as of late 2026. Using them now still helps, because many tools understand them and they make switching backends easier.
How much does LLM observability cost?
The main costs are the tool itself, which may be free if self-hosted, and the storage for traces, which grows with prompt size and volume. Sampling full content while keeping metadata for every call keeps storage manageable without losing the metrics that matter.
Sources
Related services
Building something like this?
Naman Gundaniya takes on full-stack and AI projects fixed quote after a free 30-minute scoping call, replies within 24 hours.
Get in touch